
The debug framework comes with a dedicated solution that looks for source files in dedicated project folders. If you have a project setup where you define source lookup folders this is the way to go for you. Another option is to implement source lookup completely from scratch. In our case the latter option is the easier one.
Debug Framework Tutorials
For a list of all debug related tutorials see Debug Framework Tutorials Overview.
Source code for this tutorial is available on github as a single zip archive, as a Team Project Set or you can browse the files online.
Step 1: The big picture
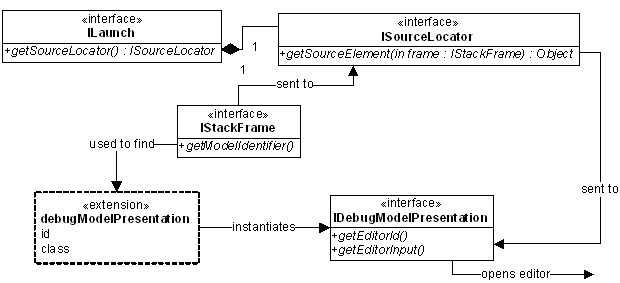
When a debug thread starts processing, it typically calls files, methods and functions. Such elements denote the call stack. The debugger framework uses this stack to resolve the current location within the source code. Each stack element may have a dedicated source location (editor content + selection within editor) attached to it.
Step 2: Adding StackFrames
The IStackFrame implementation we use is really simple: we only allow to store the current line number and to retrieve the source file. As we have only one source file available, we store it directly within our debug target.
Create a new class TextStackFrame:
public class TextStackFrame extends TextDebugElement implements IStackFrame {

 private final IThread fThread;
 private int fLineNumber = 1;

 public TextStackFrame(IDebugTarget target, IThread thread) {
  super(target);
  fThread = thread;
 }

 @Override
 public IThread getThread() {
  return fThread;
 }

 @Override
 public int getLineNumber() {
  return fLineNumber;
 }

 @Override
 public int getCharStart() {
  return -1;
 }

 @Override
 public int getCharEnd() {
  return -1;
 }

 @Override
 public String getName() {
  return getSourceFile().getName() + ", line " + getLineNumber();
 }

 public void setLineNumber(int lineNumber) {
  fLineNumber = lineNumber;
 }

 public IFile getSourceFile() {
  return (getDebugTarget()).getFile();
 }
}
For a line oriented language getLineNumber() is important as it is used for the line marker when our code is suspended. Make sure both getCharStart() and getCharEnd() return -1 in that case. If you want to mark a section within a line, implement getCharStart() and getCharEnd().As we do not have multiple source files, function calls or similar things we can stick to one static StackFrame for the whole debugging session. It is registered and updated from the TextDebugTarget:
public class TextDebugTarget extends TextDebugElement implements IDebugTarget, IEventProcessor {

 @Override
 public void handleEvent(final IDebugEvent event) {

  if (!isDisconnected()) {

   if (event instanceof DebuggerStartedEvent) {

    [...]

    // create stack frame
    TextStackFrame stackFrame = new TextStackFrame(this, thread);
    thread.addStackFrame(stackFrame);
    stackFrame.fireCreationEvent();

   } else if (event instanceof SuspendedEvent) {
    // debugger got started and waits in suspended mode
    setState(State.SUSPENDED);

    getThreads()[0].getTopStackFrame().setLineNumber(((SuspendedEvent) event).getLineNumber());
    getThreads()[0].getTopStackFrame().fireChangeEvent(DebugEvent.CONTENT);

    // inform eclipse of suspended state
    fireSuspendEvent(DebugEvent.CLIENT_REQUEST);
   }

   [...]

  }
 }
}
It is important that the StackFrame is registered before the debug UI suspends for the first time. If this is not the case the Debug view will not fully expand all its nodes and therefore not display the suspended StackFrame and the according source file in the first place. A user would have to manually expand and select the StackFrame.When executing you will now see a StackFrame child node for our thread, indicating the executed file and line number.
Step 3: Resolving source files
Resolving source elements is handled by a SourceLocator. We have to register a new one in com.codeandme.debugger.textinterpreter.debugger/plugin.xml:

The implementation of TextSourceLocator is straight forward, we only need to deal with getSourceElement():
public class TextSourceLocator implements IPersistableSourceLocator {

 @Override
 public Object getSourceElement(IStackFrame stackFrame) {
  if (stackFrame instanceof TextStackFrame)
   return ((TextStackFrame) stackFrame).getSourceFile();

  return null;
 }
}
Having a source locator we now may register it to the launch configuration. Open com.codeandme.debugger.textinterpreter.ui/plugin.xml, navigate to the Text Interpreter launchConfigurationType and set sourceLocatorId to com.codeandme.debugger.textinterpreter.debugger.sourceLocator.Step 4: Adding editor support
The final step is to define the editor to be used. This is handled by TextDebugModelPresentation:
public class TextDebugModelPresentation implements IDebugModelPresentation {

 @Override
 public IEditorInput getEditorInput(Object element) {
  if (element instanceof IFile)
   return new FileEditorInput((IFile) element);

  return null;
 }

 @Override
 public String getEditorId(IEditorInput input, Object element) {
  if (element instanceof IFile)
   return PlatformUI.getWorkbench().getEditorRegistry().getDefaultEditor(((IFile) element).getName()).getId();

  return null;
 }
}
Using the default editor for the source file is a good choice as it is up to the user to define a dedicated editor. We might add some fallback code to open the default text editor instead of returning null in an error case.Code lookup should work by now. Give it a try and step through some sample scripts.
No comments:
Post a Comment